
Municipalities have made significant gains in energy efficiency and deployment of innovative energy technology, but greater opportunities are still ahead. The Independent Electricity System Operator released a report in early May prepared for it by ICF Canada, designed to gain more insight into the current state of municipal energy use in Ontario. Ontario Municipal Energy Profile, dated February 26, was produced in collaboration with the Ontario Ministry of Energy and a group of municipal stakeholders, including Alectra Utilities and the Association of Municipalities of Ontario, with an eye in particular to future trends and sustainable energy improvements.
Below are notable observations and conclusions drawn from the report, excerpted and condensed.
• Between 2006 and 2014, municipalities in Ontario have decreased their electricity and natural gas consumption and achieved energy and cost savings as a result of actively pursuing energy savings opportunities and participating in electricity and gas energy efficiency incentive programs.
• Other improvements include: Programs focused on organizational best practices and engagement with LDCs have been developed. Municipalities are now at the forefront of adopting innovative, next-generation technologies such as net-zero buildings and net-zero or energy-plus wastewater treatment plants. They have taken the initiative to design and implement new and creative ways of funding their sustainable energy projects, a notable example of which is the green revolving fund. (Nick Ebbs at ICF Canada explains: “A municipality that decides to adopt a green revolving fund does so at the corporate level. The main premise of the fund that is that it is initiated typically using revenues from either FIT/microFIT projects or Save On Energy projects, and is dedicated to finance further sustainable energy projects, the revenues of which feed back into the fund – hence it is ‘revolving’ in this way. The municipality would initiate, own, and manage the fund.” The Federation of Canadian Municipalities also has a Green Municipal Fund for innovative, efficiency-related projects.)
Beyond that, municipalities still have significant opportunities remaining to reduce utility spending, cut greenhouse gas emissions, and upgrade infrastructure, including the electrification of space heating.
• In 2014, the primary source of energy for municipal operations (facilities, social housing, and street lighting) in Ontario was electricity (63%) and natural gas (35%), with minor use of other fuels including hot water and steam from district heating, chilled water from district cooling, propane, and fuel oils. Municipalities spent an estimated $917 million on electricity and $105 million on natural gas in 2014. Electricity consumption in 2014 was 6% less than the baseline municipal electricity consumption of 6,653 GWh estimated in 2006. Municipal electricity use continues to represent 3.7% of Ontario’s total electricity consumption. Social housing, water and wastewater treatment and pumping, and street lighting continue to be the major electricity end uses. Municipalities increased their electricity spending by 35% between 2006 and 2014, from an estimated $680 million to $917 million. The increase would have been higher if not for a 6% reduction in electricity consumption, as rates increased by an estimated 43% over the same period.
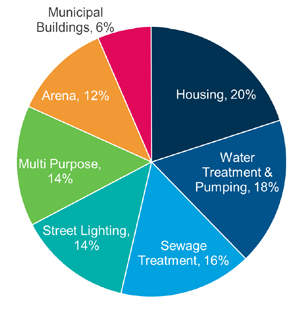 Proportion of municipal energy use by sector
Energy Efficiency: The 2008 Power Application Group Inc. report estimated an energy efficiency potential of 780 GWh based on 2006 consumption data. To date, 42% of this estimated potential (330 GWh of annual savings) has been achieved through the municipal energy efficiency projects completed through the Save On Energy Retrofit Program alone.
Proportion of municipal energy use by sector
Energy Efficiency: The 2008 Power Application Group Inc. report estimated an energy efficiency potential of 780 GWh based on 2006 consumption data. To date, 42% of this estimated potential (330 GWh of annual savings) has been achieved through the municipal energy efficiency projects completed through the Save On Energy Retrofit Program alone.
Between 2010 and 2017, approximately 74% of municipalities and municipal service boards have completed at least one project through the IESO’s Save On Energy programs, receiving approximately $44 million in incentives and achieving annual electricity savings of 330 GWh. The majority of these incentive dollars (91%) were delivered through the Save On Energy Retrofit Program.
Recommendations include:
• Improve data tracking and use.
• Prioritize facilities with high energy consumption, like water and wastewater treatment, social housing, and street lighting in the case of electricity use.
• Prioritize new construction and natural capital replacement.
• Focus on reduction, efficiency, and then generation.
• Include non-energy benefits in decision making.
Other recommendations include capacity building and training, with special attention to northern Ontario.
On energy generation, municipalities have participated in several IESO’s Energy Procurement Programs and Contracts, including the Feed-in Tariff Program, Renewable Energy Standard Offer Program, Combined Heat and Power Standard Offer Program, and Combined Heat and Power. The report finds that municipalities have 21.6 MW of generation capacity that is currently operational, and another 16.6 MW that is contracted (but not yet operational).
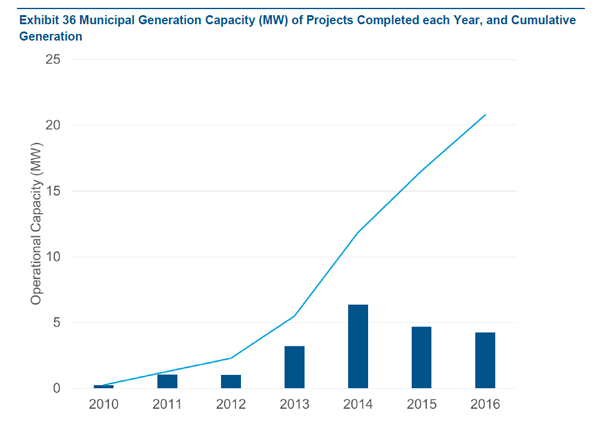 As shown here in Exhibit 36 since 2013 municipalities have installed an average of 4.6 MW per year. This is a conservative estimate, as it does not include any generation capacity from municipalities that have leased their roofing space to third parties who hold the contracts.
In a 2017 survey on on-site generation, only 20% of respondents indicated that on-site electricity generation projects have been easier to schedule over the last 5 years, and 27% expect it to be easier in the future. The report notes, however, that over 60% of the respondents answered “not applicable” or “unknown”, which implies that on-site generation may not have been explored by the majority of municipal respondents.