
In late September the IESO released the latest edition of the 18-Month Outlook and the Progress Report on Contracted Electricity Supply. The progress report contains a number of detailed breakdowns of generation projects by contract type, fuel type, connection type, and location. There is also data on projects with Aboriginal and community participation.
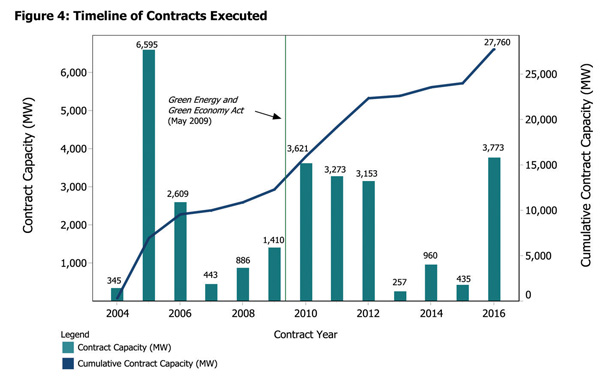 Timeline of contracts executed
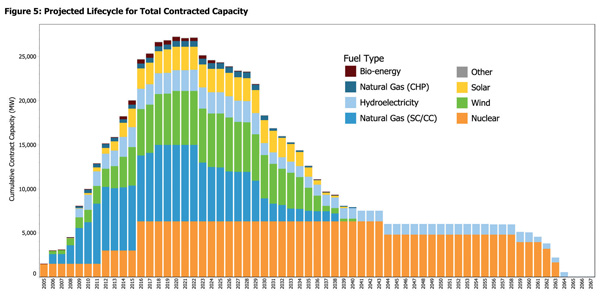 Figure 5 illustrates the projected lifecycle of total contract capacities by applying the contract term lengths to the actual commercial operation dates and expected Milestone Commercial Operation Dates (MCODs) of the facilities. The resulting graph shows how contracted capacity is expected to increase and decrease of over the life of the contracts as facilities achieve commercial operation and contracts expire at the end of the term.
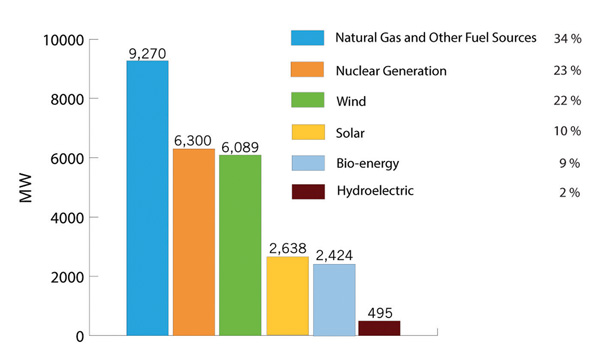 Grid-connected contracted capacity as of 2016 Q2, MW