By Stephen Kishewitsch
Proposed new climate change rules from the Obama administration, two recent major reports, and power utility efforts to respond to extreme weather events of the last year, have combined to bring the subject of climate change back into public focus. The Intergovernmental Panel on Climate Change (IPCC) has now released reports from Working Groups 1 to 3 (the basic science, socioeconomic impacts and options for mitigation), collectively totaling thousands of pages. Then, in May, an 800-page National Climate Assessment for the United States detailed the effects of climate change south of the border. Recent findings have warned that the West Antarctic ice sheet is on the brink of collapse, and the world’s oceans are expected to rise as a direct result by something like 3.3 metres (10 feet) over a period of two to ten centuries.
The list of key messages from the US Assessment is a handy summary of the picture (see sidebar at the end of this story). High level challenges for power generators related to climate change include (Chiotti and Lavender 2008):
1. Increasing incidence and magnitude of extreme weather creating requirements for reinforcement or “hardening” of infrastructure for transmission, distribution and generation.
2. Changes to water volumes and flow patterns affecting generating capacity and timing of output for hydro-electric power producers.
3. Changes to wind patterns affecting output for wind generators.
4. Changes to water levels and water temperatures in the Great Lakes impacting the efficiency of cooling systems at thermal power plants.
5. Managing the risks of disruptions to fuel supply infrastructure for generators who rely on the shipment of natural resources (like natural gas, oil or diesel) by pipeline, sea or road.
6. Increased number of cooling days placing greater demands on the generation and transmission grid, sometimes requiring additional bulk transfer capacity during peak demand periods.
Everyone is aware of the 1998 ice storm, which cost an estimated cost between $5 and $7 billion, including insurance claims. In 2013, in a more localized event, some 300,000 Toronto Hydro customers experienced a loss of service lasting up to ten days when ice-laden branches took out distribution lines, during an unusually harsh winter season that meant, among other things, no heat in sub-zero temperatures. But those are just a couple of high-profile events. There are any number of serious local incidents. The previous July, a downpour (123 mm in 24 hours at Pearson Airport, breaking the record set by hurricane Hazel) flooded Manby and Richview stations in the western GTA. Toronto Hydro lost 52 percent of its electricity load, 300,000-plus electricity customers were affected, the City estimated damage worth $65.2 million. Insurers counted $940 million in claims. Notably, there was no warning that such a severe event was imminent. Utilities worldwide have been struggling to assess the issue and to develop prudent plans to respond to what appears to be the “new normal.”

Utilities preparing to adapt
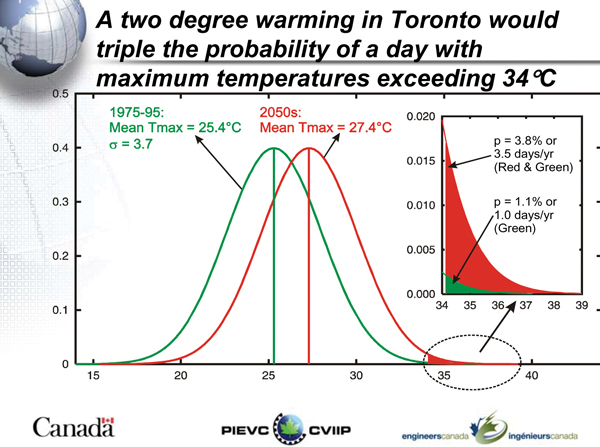
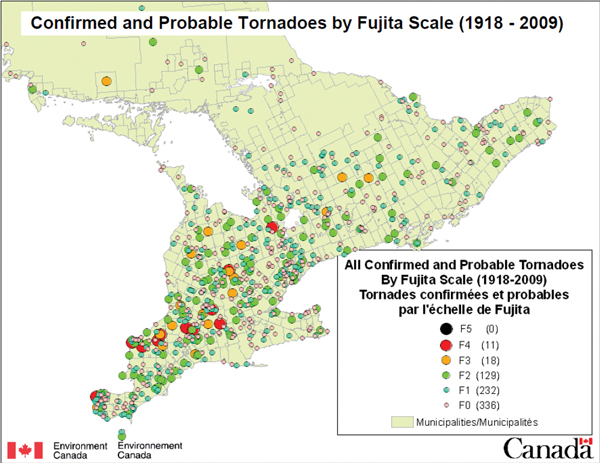
The November issue of IPPSO FACTO carried an article, based in part on a presentation by AECOM’s Michael Nolan at the November 2013 APPrO conference, addressing the issues that utilities need to consider in preparing for the effects of climate change. Detailed studies are now underway, beginning the process of identifying vulnerabilities and costs at an operational level. Part of the work involved is based on trying to anticipate in detail the climate, and the kind and frequency of extreme weather events, that we can expect two and five decades hence and more. Conditions like these are harder to anticipate in specific terms than next week’s barbecue weather, but something that system participants need to be able to prepare for. Do transmission and distribution utilities need to plan for increased frequency and severity of lightning strikes, incidents that can take out a line or a transformer station? Do we have to prepare for more frequent high winds, or even tornadoes, that can tear lines or transformer stations apart? What intensity of tornado – EF2? EF4? A line or a station – reinforced to some degree dictated by the calculus of cost versus risk, might survive one but not the other. As Simon Eng at Risk Sciences points out, we can expect climate zones, to a first order of approximation (“climate analogue” is the preferred term), to shift northward as the century progresses. The kind and frequency of storms that Ohio experiences today – wide-area phenomena, like ice storms, at least; smaller-scale events like tornadoes are harder to model – we can expect to see in Ontario, perhaps in twenty years, he says. The temperatures Kentucky experiences today are a guide to what we can expect towards the end of this century, say around 2080. So that’s a guide as well to the hazards to the system that Ontario can also anticipate.

And the Question of all questions: how much will such preparedness cost, and how will it be paid for? Beginning when? The Canadian Electricity Association has an estimate that some $350 billion will be required by 2030 to repair, upgrade or replace existing equipment, just to maintain the existing grid and meet demand growth. That’s without having factored the need for climate change adaptation at all. The Federation of Canadian Municipalities observes that the ongoing impact of climate change is expected to increase Canada’s “infrastructure deficit” by shortening asset-replacement cycles. Yet Michelle Turner, Director of Generation and Environment at the CEA, notes that there has not yet been a rate case in Canada where a utility has gone on the record requesting incremental investment for adaptation considerations.
The scale of the challenge
At other levels of governance, the federal government has a research/development role and will need to have policies to facilitate adaptation; provinces will need to support incremental infrastructure investments in support of climate preparedness; and the public will need to be made aware so that it is prepared to support what needs to be done.
Recently a survey of some 200 Ontario municipalities found that the potential of power outages related to climate was considered their top hazard for the future. Among their concerns: the effect of heat and humidity on the vulnerable, including the homeless; loss of power to hospitals, police stations, emergency dispatch centres, and telecommunications, complicating emergencies created by other extreme weather effects, notably flooding.
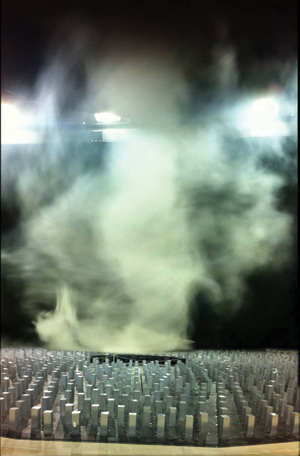
It’s instructive to see what unexpected vulnerabilities turn up when you get down to the details. Just as a sample, Ashraf El Damatty, Professor of Engineering at Western University, describes how new types of wind stresses, like downbursts and very localized wind gusts from increasingly frequent violent storms, have to be factored into tower design. Differences in winds over a scale of merely a hundred meters can pull at one part of a line while pushing on another part just the other side of a tower. Heavy regional winds all in one direction are a known quantity, but transmission systems are going to have to be built to withstand vibration and twisting forces from tornado-like winds. Manitoba Hydro began recognizing the issue in the mid-1990s when downbursts during heavy storms took out sections of line and caused not just loss of service but loss of revenue from months worth of no deliveries south of the border. UWO has a new wind tunnel, the first in the world, that can test such effects on models (see photo).

The facility has incidentally accumulated a kind of museum of something like a thousand model high-rise structures from around the world, that have been used to test for wind loading.
A quick sample of some other effects of concern:
• Wind doesn’t have to hit a station directly, it can simply throw debris at it, putting it out of service. Stronger and more violent storms are a prediction of the climate models.
• Switching gear has temperature thresholds beyond which it is more liable to trip more easily.
• Some substation transformers use sulphur hexafluoride insulation, which is sensitive to extreme low temperatures, paradoxically also a potential result of the jet stream dragging arctic air further south, as we saw in the winter just passed.
• Wire sag in high air temperatures and under high demand, with the potential of contacting tree limbs – the trigger event for the 2003 blackout. In high ambient temperature conditions, cables need to be de-rated for the power they can carry. Wire tensile strength is reduced under high temperatures, generated both by high air temperatures and the heavy current they’re called on to supply air conditioning.
• Increases in CO2 concentrations and temperature are known to cause the accelerated deterioration of concrete through carbonization. Compounded with increased freeze-thaw cycles and de-icing salt application, maintenance costs can be expected to rise over the years, along with the potential for unexpected failures.
• System vulnerabilities are liable to be increased by compound conditions, like high temperatures and humidity, with associated high demand, when feeder shutdown is restricted, compounded by heavy rainfall causing flooding in underground vaults.
Preparation options
Then, what preparations need to be made against new, more severe or more frequent contingencies? Do utilities have to purchase expensive extra backup equipment, like a replacement transformer, sitting in a warehouse, ready to replace something that gets damaged? How many, strategically located where? What will it cost? It may be that the cost of hardening individual installations will have to be weighed against the cost of built-in system redundancy, such as the ability to reroute power if one part of the grid is taken out of operation. Does the system need more redundancy to be properly prepared?

One early-stage detailed risk analysis is underway for Toronto Hydro at the distribution level, and another at the transmission level by the OPA, with support from Hydro One and other transmission asset owners. There is a certain amount of commonality in the areas of study between the two, with the same people on an advisory committee. Both are using a well-respected engineering protocol developed by the Public Infrastructure Engineering Vulnerability Committed (PIEVC) of Engineers Canada. Details are available at pievc.ca.
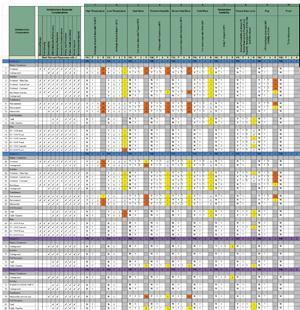
It’s fairly easy to identify potential concerns in a general way, but dealing with the details of adaptation at an operational level rapidly becomes more complex than the casual observer might think. What wind speed should a study take as its threshold of concern? Each piece of equipment is exposed to its particular set of risks, under particular conditions, which changes depending on the climate zone it’s in. Preliminary studies have done that analysis, for example for some of Toronto Hydro’s system, resulting in a detailed table (see sample chart at left).
Trying to provide such a list for every piece of equipment across Ontario would be an overwhelming task, so the case study underway for the transmission system is taking its time to carefully select one or two substations, representative enough to apply to the system in general, or at least some important components. For example, in any given study the area chosen should probably include emergency response services like hospitals, police and so on. A second level of analysis seeks to identify climate zones with different weather behaviour, so that between the two levels of analysis, general plans can be prepared for every part of the system.
Getting work underway
It’s an iterative process, explains Simon Eng at Risk Sciences International, which is providing the climate and severe weather expertise for the studies for Toronto Hydro and Hydro One. (Engineering firm Nodelcorp is the lead on PIEVC – they in fact led development of the protocol itself. The Clean Air Partnership and AECOM are the leads on the Toronto Hydro study.) After identifying a suitable case study area, based on the characteristics of the service area and the type of local climate, the participants then workshop with a panel of experts and ask questions like what thickness of ice on the wires will cause them to break? What wind speed should be the triggering level of concern – 90 k/h, over 110 k/h?
The Toronto Hydro study is to be delivered at the end of Q1 2015; and Q2 for Hydro One.
Professor Blair Feltmate at the University of Waterloo and Intact Financial Chair of the Climate Change Adaptation Project (Canada), points out that for nine of the last eleven years, the money coming in to the insurance industry has not paid for the claims in those years, related to damage caused by weather.
“Some parts of Canada have become effectively uninsurable,” he says. Case in point, High River in Alberta. Yet developers are still allowed to build on areas that are now vulnerable to flooding. And, to bring this back to the power sector, where the houses go is where the distribution system has to follow, he points out. We need to update Canada’s floodplain maps, currently dating from 1992-94 if not earlier, he says. They need to show not just where the water can go today, but where it will go in 25, 50 and 75 years. As storms become heavier and more frequent, higher flood waters will discover new paths that previously would have been high and dry. Feltmate recounts the experience of an area in Downsview, northern Toronto, with no streams running through it. Yet a couple hundred houses were flooded out three times in 2013, to the point where each looked like an island in a lake, though they are normally surrounded only by grass and asphalt. It was a confluence of three storm drains that overflowed during heavy rainfall and sent excess water back up through the sewers outlets. Those homes are close to worthless, he says, and we’re starting to see events like this regularly. That means more substations and underground transformer vaults at risk.
“This is one of the top two or three files where, if we don’t get it right, we will be seriously diminished as a country,” says Feltmate. “This is a show-stopper for Canada. We’re building infrastructure that is maladapted to the future we will face. What we have now is management by disaster. How do we get ahead of the curve?”
Organizations involved in adapting to climate change
A possibly surprising number of organizations have an interest in and are involved, directly or indirectly in some way, with the need to prepare for the effects of climate change. The following is only a list of organizations, with a presence in Ontario, encountered in preparation of this article.
• AECOM conducted a preliminary risk assessment for the Toronto Hydro system.
• Canadian Electricity Association. A study conducted by the CEA with the CSA in 2012 found that the majority of engineers agree that climate change has or will affect their engineering decisions, but need more information to address it in their practice.
• Canadian Standards Association, CSA, is working with Engineers Canada to update standards.
• City of Toronto
• Clean Air Partnership
• Engineers Canada, in particular its Public Infrastructure Engineering Vulnerability Committee (PIEVC), which has a protocol for infrastructure risk assessment and adaptation to a changing climate. A study is due out in the fall of 2015, “The Impacts of Climate Change on Electricity Infrastructure Investments: A National Perspective.”
• Hydro One
• Independent Electricity System Operator, IESO. As the Reliability Coordinator, Transmission Operator and Balancing Authority for the province, the IESO is required to comply with a variety of reliability standards including Emergency Preparedness. Most recently, the North American Electric Reliability Corporation (NERC) established a Severe Impact Resilience Task Force that identified 33 recommendations to enhance the resilience of the North American bulk power system. The IESO participated in the development of best practices amongst other Reliability Coordinators in response to these recommendations and takes part in numerous simulation exercises throughout the year, including NERC’s GridEx simulation.
• Natural Resources Canada, which is funding studies by Toronto Hydro and Hydro One.
• Ontario Centre for Climate Impacts and Adaptation Resources (OCCIAR), climateontario.ca
• Ontario Ministry of Energy
• Risk Sciences International, coordinating studies for Toronto Hydro and Hydro One.
• The insurance industry generally, of course. Intact Financial, the largest property casualty insurance firm in Canada, funds Canada’s Climate Change Adaptation Project, at the University of Waterloo.
• Toronto and Region Conservation Authority, the largest of 36 such organizations in the province, which promotes renewable energy as well as watershed management. “It’s all about interdependencies,” says Chandra Sharma, senior manager on climate change at the TRCA. “If one system fails it impacts your transportation system, your social system, it’s a ripple effect.”
• Toronto Hydro
• Weatherwise Partnership, with Toronto Hydro, the City of Toronto, IESO, OPG, Ministry of Energy, Hydro One
What the US can expect from a changing climate
"We know with increasing certainty that climate change is happening now. While scientists continue to refine projections of the future, observations unequivocally show that climate is changing and that the warming of the past 50 years is primarily due to human-induced emissions of heat-trapping gases. These emissions come mainly from burning coal, oil, and gas, with additional contributions from forest clearing and some agricultural practices." – From Climate Change Impacts in the United States.
Key Messages
1. Global climate is changing and this change is apparent across a wide range of observations. The global warming of the past 50 years is primarily due to human activities.
2. Global climate is projected to continue to change over this century and beyond. The magnitude of climate change beyond the next few decades depends primarily on the amount of heat-trapping gases emitted globally, and how sensitive the Earth’s climate is to those emissions.
3. U.S. average temperature has increased by 1.3°F to 1.9°F since record keeping began in 1895; most of this increase has occurred since about 1970. The most recent decade was the nation’s warmest on record. Temperatures in the United States are expected to continue to rise. Because human-induced warming is superimposed on a naturally varying climate, the temperature rise has not been, and will not be, uniform or smooth across the country or over time.
4. The length of the frost-free season (and the corresponding growing season) has been increasing nationally since the 1980s, with the largest increases occurring in the western United States, affecting ecosystems and agriculture. Across the United States, the growing season is projected to continue to lengthen.
5. Average U.S. precipitation has increased since 1900, but some areas have had increases greater than the national average, and some areas have had decreases. More winter and spring precipitation is projected for the northern United States, and less for the Southwest, over this century.
6. Heavy downpours are increasing nationally, especially over the last three to five decades. Largest increases are in the Midwest and Northeast. Increases in the frequency and intensity of extreme precipitation events are projected for all U.S. regions.
7. There have been changes in some types of extreme weather events over the last several decades. Heat waves have become more frequent and intense, especially in the West. Cold waves have become less frequent and intense across the nation. There have been regional trends in floods and droughts. Droughts in the Southwest and heat waves everywhere are projected to become more intense, and cold waves less intense everywhere.
8. The intensity, frequency, and duration of North Atlantic hurricanes, as well as the frequency of the strongest (Category 4 and 5) hurricanes, have all increased since the early 1980s. The relative contributions of human and natural causes to these increases are still uncertain. Hurricane-associated storm intensity and rainfall rates are projected to increase as the climate continues to warm.
9. Winter storms have increased in frequency and intensity since the 1950s, and their tracks have shifted northward over the United States. Other trends in severe storms, including the intensity and frequency of tornadoes, hail, and damaging thunderstorm winds, are uncertain and are being studied intensively.
10. Global sea level has risen by about 8 inches since reliable record keeping began in 1880. It is projected to rise another 1 to 4 feet by 2100.
11. Rising temperatures are reducing ice volume and surface extent on land, lakes, and sea. This loss of ice is expected to continue. The Arctic Ocean is expected to become essentially ice free in summer before mid-century.
12. The oceans are currently absorbing about a quarter of the carbon dioxide emitted to the atmosphere annually and are becoming more acidic as a result, leading to concerns about intensifying impacts on marine ecosystems.
