
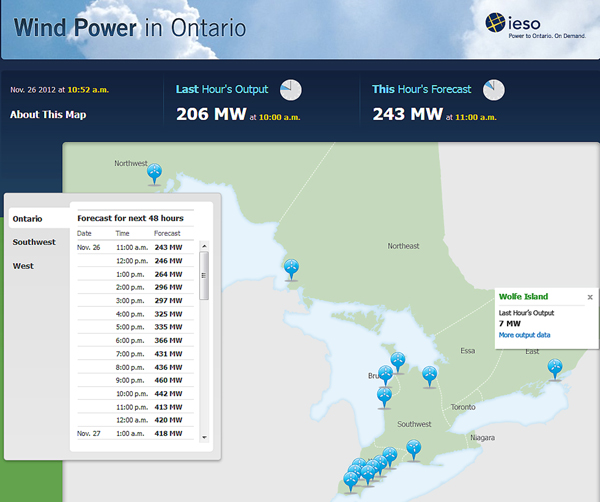
The Independent Electricity System Operator has published a new interactive Ontario Wind Map (www.ieso.ca/map) that illustrates the amount of wind energy forecast to be available throughout the day. This map utilizes data from the IESO’s new Centralized Forecasting Service that more accurately predicts the generation output from wind and solar facilities in Ontario. The map and data shows the last hour’s output of each wind facility connected to the transmission-level grid, as well as the forecast hourly output for the next 48 hours.
Later next year the forecast for solar facilities connected to the transmission-level grid, as well as distribution-connected wind and solar facilities with an installed capacity over five megawatts, will be included.