
Three trends helped shape the management of Ontario’s power system in 2011: increasing production from renewable resources, reduced dependence on coal-fired units, and a more active role for consumers in managing their consumption.
With a total installed capacity of more than 1,700 megawatts at year-end, Ontario’s wind generators are playing an increasingly important role in meeting demand for electricity. Total production rang in at 3.9 terawatt hours – up substantially from 2.8 TWh in 2010. November 2011 marked the highest monthly wind output ever seen in Ontario, with production in that month alone exceeding 0.56 TWh. In annual terms, wind generation represented 2.6 per cent of total output across all fuel types of 149.9 TWh.
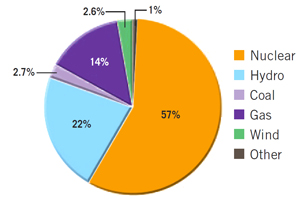
Production from Ontario’s nuclear units continues to supply more than half of Ontario’s power needs. Nuclear generation rose slightly in 2011 to 85.3 TWh, an increase of 2.4 TWh from 2010. By contrast, output from Ontario’s coal-fired units dropped to 4.1 TWh in 2011, two-thirds lower than it was the year before. After unusually low water levels resulted in reduced hydroelectric output in 2010, production rebounded to 33.3 TWh from 30.7 TWh. Natural gas facilities rounded out the mix, with production of 22.0 TWh, up from 20.5 TWh in 2010. The pie-chart reflects total electricity output in 2011 by fuel type.
Total electricity consumption in Ontario dipped slightly to 141.5 TWh, down from 142 TWh in 2010. A heat wave in late July pushed peak hourly demand to 25,450 MW on July 21 – a 375 MW increase from 2010’s peak. The increase would have been even higher if not for demand response program participants. During the peak hour, demand for electricity was reduced by more than 500 MW through various DR programs and pricing incentives.
The total cost of power in 2011 was 7.16 cents per kilowatt hour, up from 6.52 cents/kWh in 2010. This cost includes the average weighted wholesale market price of 3.15 cents per kWh.
— The IESO Electricity Insider, February 2012.