
The following report is from the Canadian Industrial Energy End-use Data and Analysis Centre (CIEEDAC):
One of CIEEDAC’s mandates is to address data gaps as they relate to understanding Canada’s energy system. Three such gaps were identified and, in 2013, CIEEDAC received funding from a number of sources to update two databases – cogeneration and renewable energy – and install a new one on district energy. All three, currently on line on CIEEDAC’s website, can be queried for their information. Support for this research came from Environment Canada, Natural Resources Canada and BC’s Ministry of the Environment. There is some overlap between these three databases in that a particular facility may show up in all of them; there are district energy systems that cogenerate using renewable energy. CIEEDAC staff are working to harmonize the three databases.
Each of the databases is accompanied by a report, also available on line at CIEEDAC. The reports provide background to the databases, data collection, and some of the analysis completed on the data sets. Here, we provide a summary of the data; we recommend downloading the full copy of the report if further detail is required.
Cogeneration
This database contains information on over 240 cogeneration systems with a total operating capacity of at least 9.5 GWe. Currently, Alberta has the largest cogeneration capacity of 4.3 GWe, ahead of Ontario at 2.4 GWe. Together, the two provinces account for 70% of total capacity in Canada. Gas turbines assume 61% of all electricity generation capacity from cogeneration in Canada with steam turbines of various sorts the second largest category at 26%. Because respondents did not always provide thermal capacities of their systems, we were not able to provide a full accounting of thermal capacity by technology type.
CO2 emissions from cogeneration units are estimated using data available. Roughly 4-5% of total Canadian GHG emissions, about 34 Mt, are emitted yearly from cogeneration systems. Emissions from utilities and the oil and gas extraction facilities (primarily bitumen operations) accounted for 2/3 of the total. Production data were also estimated.
Electricity generation is 43.7 TWh/yr., while thermal generation is 142.2 TWh/yr for an average heat to power production ratio of about 3:1. The bulk of the electricity (just over 2/3) of the electricity came from utilities and oil and gas operations and roughly half of the thermal energy came from wood products operations, primarily pulp and paper mills.
When classed by sector, the utilities sector has the most cogeneration, 4.8 GWe or 50% of total operational capacity. Oil and Gas Extraction has the next highest electricity capacity at 1.9 GWe, about 20% of operating capacity. However, we estimate that the Paper and Wood Products sector operates 62% of cogeneration thermal capacity.
The performance of cogeneration systems in Canada varies widely from a low of 18% to a high of 95%. The average annual electrical production is 5,280 kWh/kWe of operating capacity, the average efficiency is 69% and the average heat-to-power ratio is 3.4. Typically, condensing steam turbine systems are the most efficient (81%) and diesel systems are the least efficient (41%). However, data on the operating efficiency of different types of cogeneration units is limited.
Renewable Energy
The RE database contains information on over 1,400 renewable energy facilities. Details on known capacity of the various sources of renewable energy are found in the table below. As expected, hydroelectricity dominates. “Other” includes tidal, solar thermal and geothermal energy.
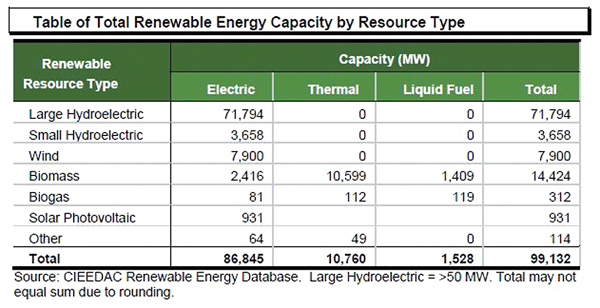 Total renewable energy capacity from identified facilities in Canada was approximately 99 GW in 2013, 72% of which is from hydroelectric dams. We estimate that renewable energy currently accounts for 11% of Canada’s primary energy production and 67% of its electricity generation in 2013. These estimates depend on assumptions about the capacity factor of different types of renewable energy, which are uncertain.
Since 2000, the installation of wind turbines contributed to over half of the increase in Canadian renewable energy capacity. Wind now accounts for 7.9 GW of electrical capacity (9% of total renewable capacity) in Canada. Nearly 1 GW of solar photovoltaic capacity has been added in recent years, the majority of which has occurred in Ontario.
In addition to providing thermal energy for industrial applications, biomass is increasingly being used to provide thermal energy for community heating as well as liquid fuels for transport. Over 375 biomass facilities were added to the database in this year’s update.
Certain renewable energy sources, notably distributed earth energy (heat pump) and solar thermal (solar water heaters) are under-represented in the database. CIEEDAC is taking steps to identify appropriate data sources and methods for incorporating these renewable energy sources into the database.
District Energy
We identified 116 operating DE systems across the country. Of these, responses were received for 60 facilities, providing insight into the nature of district energy systems in Canada. Ontario and British Columbia have the greatest number of systems. Of the systems we identified, 34 are in Ontario and 25 are in British Columbia, together accounting for half of all systems in Canada.
District energy facilities provide a range of services, including heating, cooling and electricity. Half of all facilities offer heating only; one third offer heating and cooling; and one fifth offer electricity through cogeneration with heating and/or cooling. The data show a recent surge in the construction of district energy facilities. Half of all facilities have been commissioned since 2000.
District energy facilities use a wide variety of fuels. Facilities reported using gaseous and liquid fossil fuels, biomass, geoexchange, electricity, surplus heat from industrial processes, energy extracted from waste water effluent, cooling using sea and lake water, municipal solid waste and solar energy.
District energy facilities reported serving a total of 2,478 buildings. The average number of buildings served is 43. The largest number of buildings served by a single facility is 302.
The total thermal energy delivered by heating and cooling systems in 2012 reached 5.2 million MWh. This energy accounts for about 1% of the total building energy consumption for space heating, space cooling and water heating in Canada. This figure underestimates the contribution of district energy because it does not account for facilities that did not respond to the survey.
The majority of facilities report planning some level of expansion to their operations in the future. Planned expansions include increases to installed generation capacity, size of distribution network, and number of end user connections.
— Canadian Industrial Energy End-use Data and Analysis Centre (CIEEDAC) www.cieedac.sfu.ca