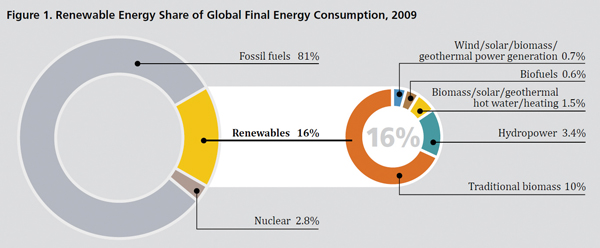
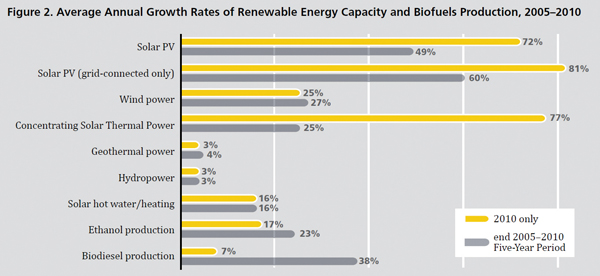
Research on worldwide investment activity has found that renewable capacity continued to grow strongly in 2010 despite the global recession and other factors that might have been expected to put a brake on growth in the sector. Even though many countries cut their incentive programs for renewable energy and long term natural gas prices became more attractive, worldwide renewable generation grew 25% in 2010. Hydroelectric capacity is excluded from these comparisons because of the large volumes of legacy hydroelectric generation, but growth was strong nonetheless even if hydroelectric capacity is included. These are some of the results of a study by REN21, the Renewable Energy Policy Network for the 20th century.

Renewable Energy World notes that “renewable energy accounted for approximately half of the estimated 194 GW of new electric capacity added globally during 2010 while existing renewable power capacity worldwide reached an estimated 1320 GW in 2010, up almost eight percent from 2009.” Meanwhile, overall energy use declined in 2009, largely as a result of the global recession, and rebounded 5.4 percent in 2010.

Financing for the REN21 study was provided by the German Federal Ministry for Economic Cooperation and Development (BMZ), the German Federal Ministry for Environment, Nature Protection and Nuclear Safety (BMU), the Indian Ministry of New and Renewable Energy, and the Asian Development Bank.
For more information see http://www.ren21.net/Portals/97/documents/GSR/GSR2011_Master18.pdf.
Selected excerpts from REN21
• New investment in renewable energy in 2010 amounted to US$ 211 billion, up from $160 billion in 2009, and $130 billion in 2008.
• China led the pack in total new capacity investment, with an estimated 29 GW of grid-connected renewable capacity, for a total of 263 GW. Renewables accounted for about 26% of China’s total installed electric capacity, 18% of generation, and more than 9% of final energy consumption in 2010.
• Next in total investment, China was followed by Germany, the United States, Italy and Brazil. The US still leads in terms of total capacity (hydro power excluded) (see figure 4).
• By early 2011, at least 119 countries had some type of policy target or renewable support policy at the national level, up from 55 countries in early 2005. Commercial wind power existed in just a handful of countries in the 1990s but now exists in at least 83 countries. Solar PV capacity was added in more than 100 countries during 2010.
• Technology cost reductions in PV in particular meant high growth rates in manufacturing, with a similar though less pronounced pattern in wind.
• The trend toward utility-scale PV plants continued, with the number of such systems exceeding 5,000 and accounting for almost 25% of total global PV capacity.
• PV cell manufacturing continued its shift to Asia, with 10 of the top 15 manufacturers located in the region. Industry responded to price declines and rapidly changing market conditions by consolidating, scaling up, and moving into project development.
• Average turbine sizes continued to increase in 2010, with some manufacturers launching 5 MW and larger machines, and direct-drive turbine designs captured 18% of the global market.
• Worldwide, national estimates for job creation in the wind subsector total about 630,000, led again by China (150,000), Germany (100,000), the United States (85,000), and then Spain, Italy, Denmark, Brazil and India.
